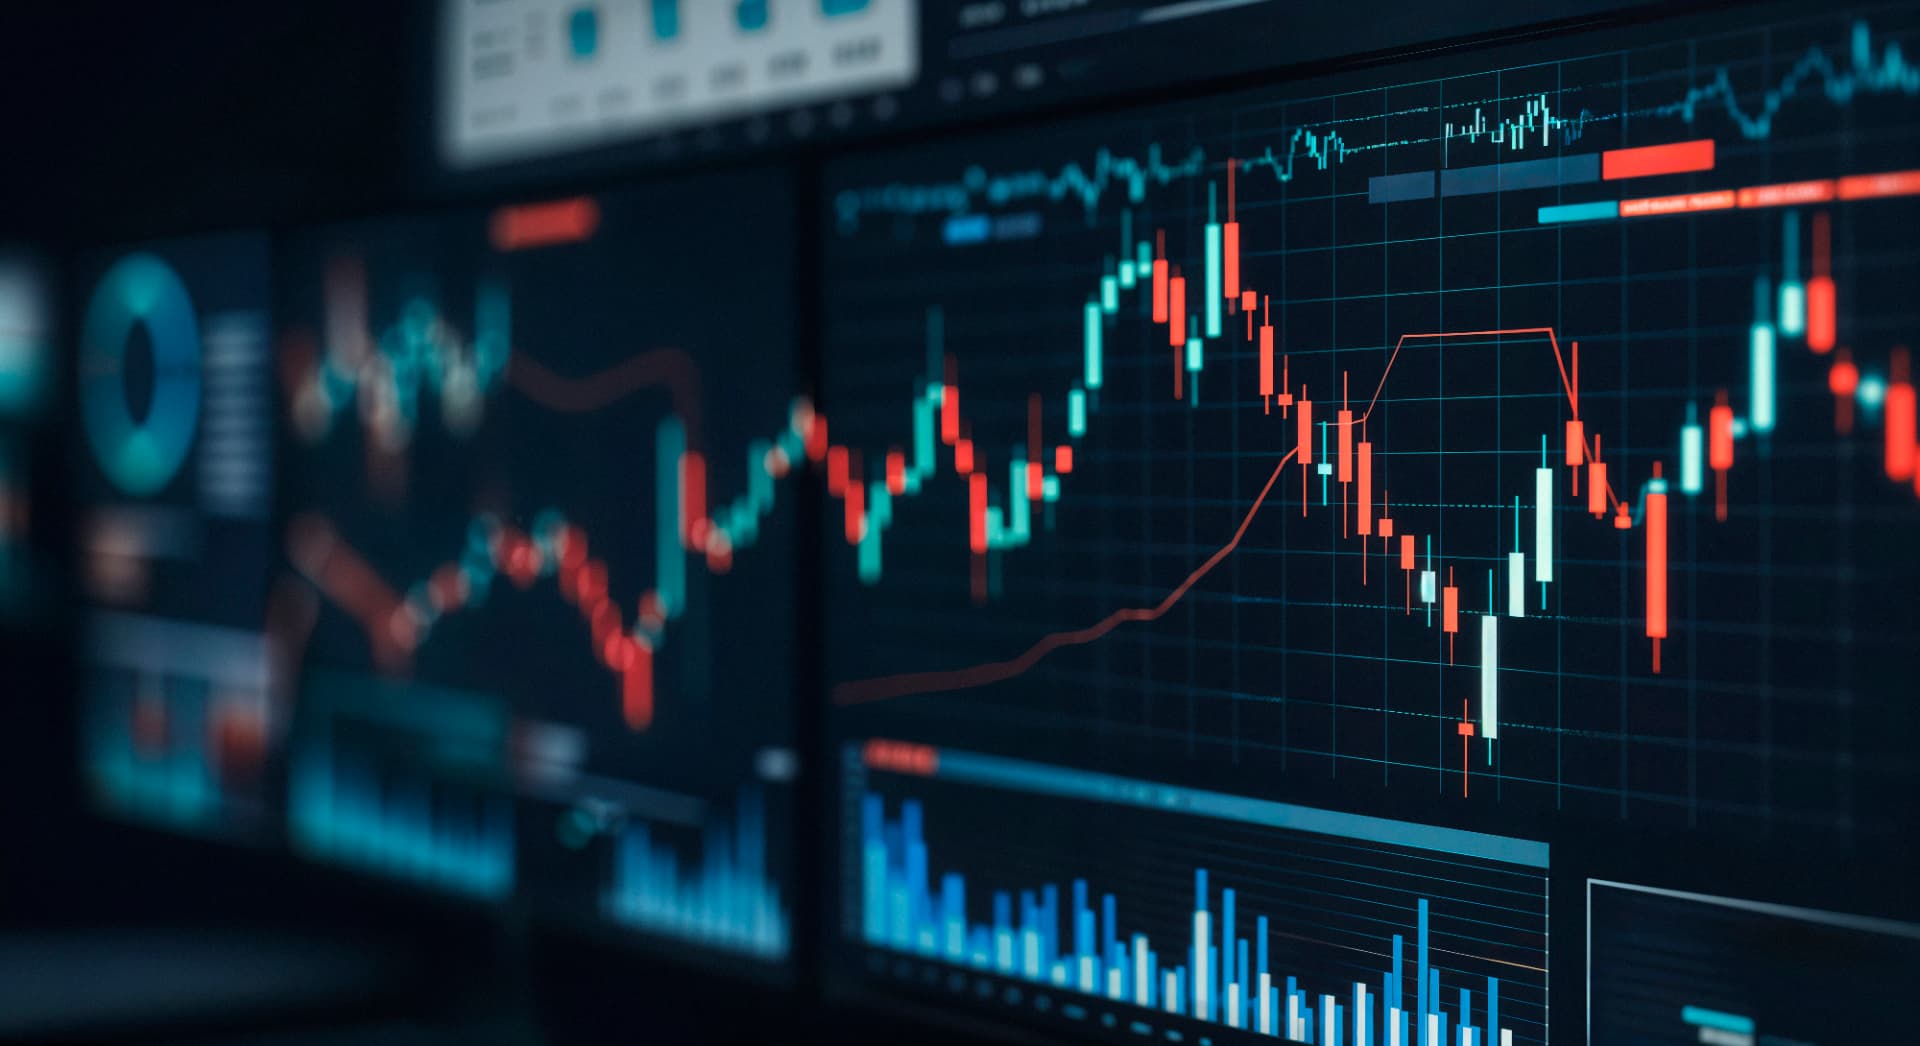
Financial market displays with teal and red candlestick charts and trading volume

INDEPENDENT MARKET INTELLIGENCE

Alpha Parlor.

Follow the capital.
Understand the company.

From the first price move to the underlying financials. A connected perspective on global markets, options activity and company research.

A RESEARCH WORKSPACE · SAMPLE & PROVIDER DATA CLEARLY LABELED

THE MARKET DOESN’T STAND STILL

Read the tape.
See the context.

A price change is only the beginning. Trace options activity, compare contracts and keep the news in view.

Open the research desk

ALPHA PARLOR / MONITOR

SIMULATED REPLAY

01 / QUOTE MONITOR · SAMPLE

TickerLast / USDChangeVolume
AAPL228.10+1.79%52.1M
NVDA142.60+1.27%36.4M
TSLA311.90+1.51%48.9M
MSFT421.30+2.96%37.6M
AMZN208.70-2.62%74.5M

02 / OPTIONS ACTIVITY · SAMPLE

Time ETContractTypePremium
14:59:51NVDA 140CSWEEP$1.57M
14:59:15NVDA 137.5PSWEEP$16K
14:57:00NVDA 137.5CBLOCK$1.25M
14:56:51NVDA 152.5CBLOCK$104K
14:53:24NVDA 145CSWEEP$75K

03 / NEWS WIRE · ILLUSTRATIVE

01

AI infrastructure spending puts semiconductor stocks in focus

09:42 ET · ALPHA PARLOR SAMPLE WIRE

02

Treasury yields ease as markets look ahead to inflation data

09:33 ET · ALPHA PARLOR SAMPLE WIRE

03

Crude oil supply outlook brings energy stocks back into focus

09:18 ET · ALPHA PARLOR SAMPLE WIRE

04 / NVDA OPTIONS CHAIN · SAMPLE

Call bidCall ΔStrikePut ΔPut bid
7.510.71137.5-0.292.51
5.300.61140-0.392.75
2.940.50142.5-0.502.84
2.770.40145-0.605.12
2.530.29147.5-0.717.33
SAMPLE DATA · NOV 06, 2026 · NOT LIVEREPLAY PAUSED

BEHIND THE TICKER

The business behind the price.

Revenue, profitability, valuation and balance-sheet strength. Different dimensions of the same company.

NVDA / Quarterly revenue

SAMPLE · USD BILLIONS

NVDA / Financial snapshot

Market capitalization
$1.10T
Revenue / annual
$184.51B
Price / earnings
48.6×
Earnings / share
$2.93
Gross margin
64.6%
Net margin
7.0%
Return on equity
19.7%
Debt / equity
0.35×

ILLUSTRATIVE FINANCIALS · GENERATED SAMPLE VALUES, NOT COMPANY FILINGS

Open NVDA research

CROSS-ASSET SNAPSHOT

SAMPLE · NOV 06, 2026
S&P 500SPX
5,995.00-2.74%
LOW 5,977.97HIGH 6,001.05
BitcoinBTCUSD
76,400.00-0.47%
LOW 76,166.56HIGH 77,105.22
Gold spotXAUUSD
2,684.00-1.69%
LOW 2,667.39HIGH 2,710.66
WTI crudeWTI
71.38-2.64%
LOW 70.59HIGH 71.56

PRICE / VOLUME / CONTEXT

The market, in detail.

Open workspace

NVIDIA Corp

NASDAQ · USD · SAMPLE OHLCV

142.60

+1.27%

NVDA · 1D

ILLUSTRATIVE PRICE HISTORY · NOT A LIVE MARKET FEED

RELATIVE PERFORMANCE

One view. Different trajectories.

NVDAAAPLMSFT90 SESSIONS · SAMPLE · REBASED TO 0%

THE BIG PICTURE

Beyond the price.

View global markets
01

Markets, in context.

Equities, futures, currencies, crypto and commodities.

02

Follow the activity.

Options chains, unusual activity and off-exchange prints.

03

Know the company.

Financials, price history, news and company research.

ON THE RESEARCH DESK

The names in focus.

A closer look at technology, energy and financials.

01

Apple Inc

AAPL · SAMPLE

+1.79%
02

NVIDIA Corp

NVDA · SAMPLE

+1.27%
03

Tesla Inc

TSLA · SAMPLE

+1.51%
04

Microsoft Corp

MSFT · SAMPLE

+2.96%

THE ALPHA PARLOR PERSPECTIVE

“Price is a point.
Context is the bigger picture.”

Independent research. Clear sources. A wider view of the market.

Enter the terminal